

First Gold Rises, Then Bitcoin? Not Exactly
The real explanation involves China's central bank, a statistical test, and a distortion pointing to $140,000.

There is a statistical anomaly unfolding right now in the markets that should keep any serious investor up at night. The ratio between Bitcoin and gold prices has just hit the third standard deviation this year — a distortion that historically corrects within 7 to 8 months. If this reversion happens with gold at current levels, Bitcoin should be at $140,000.
But before we get to that number, we need to understand the mechanics behind this dynamic. And it starts, above all, with China.
Beijing’s Invisible Hand in the Gold Market
There is a growing narrative in the market that gold movements anticipate Bitcoin’s. The hypothesis is simple: there is a portfolio rotation — money flows into gold first, then migrates to higher-risk assets like Bitcoin. The result is that both follow the same trajectory over the medium and long term, but at different times.
We decided to test this hypothesis with statistical rigor. And the first step was to investigate what actually drives gold.
The most powerful answer we found: Chinese liquidity.
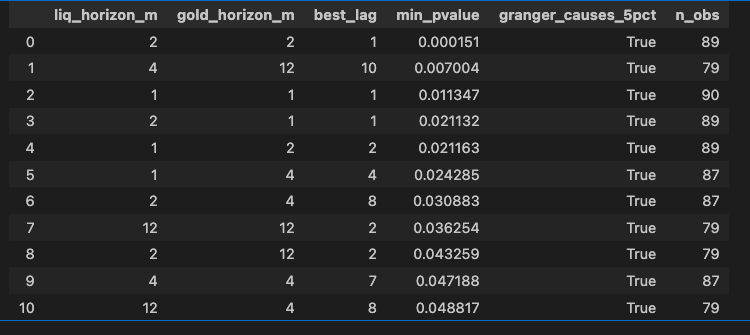
We ran Granger causality tests — an econometric tool that checks whether one variable has predictive power over another — and the results were clear. The liquidity flow from the People’s Bank of China (PBOC), measured over 2-month windows, generates statistically significant returns in gold over that same horizon. The lowest p-value we found was 0.00015 — a significance level that, in practical terms, is hard to dispute.
And what has China done with its liquidity in recent months? It injected a massive amount. In 2025 alone, roughly 1 trillion dollars, with another trillion expected ahead.
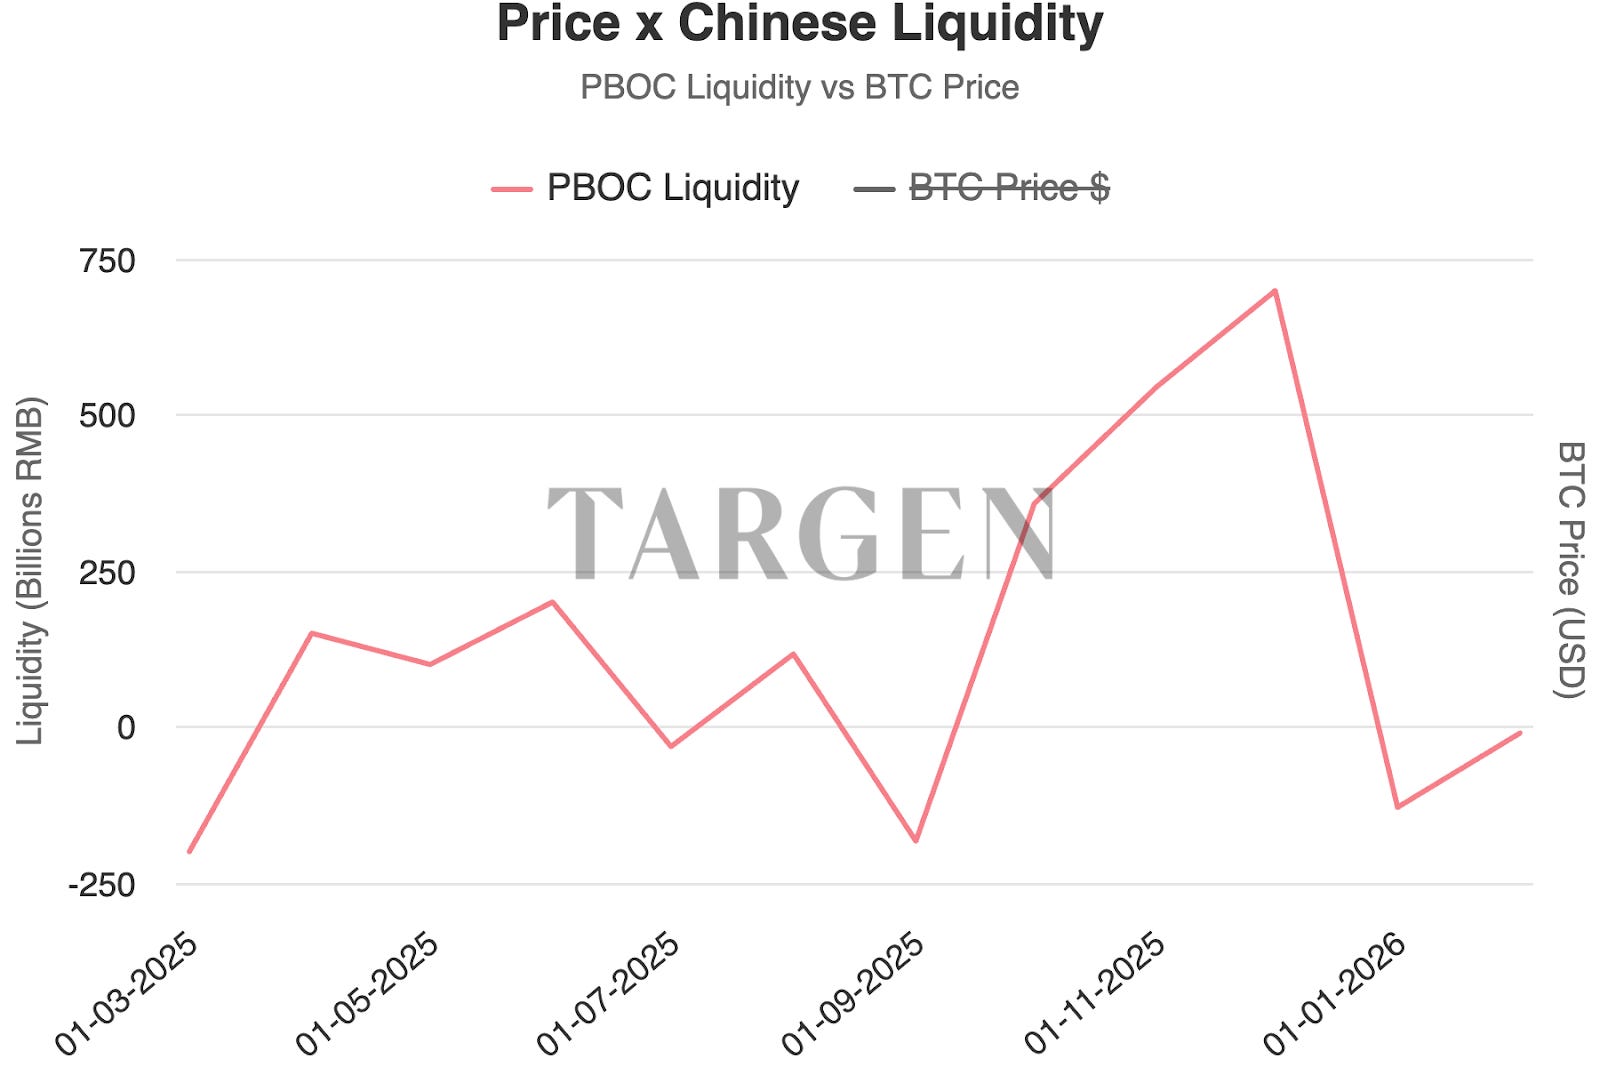
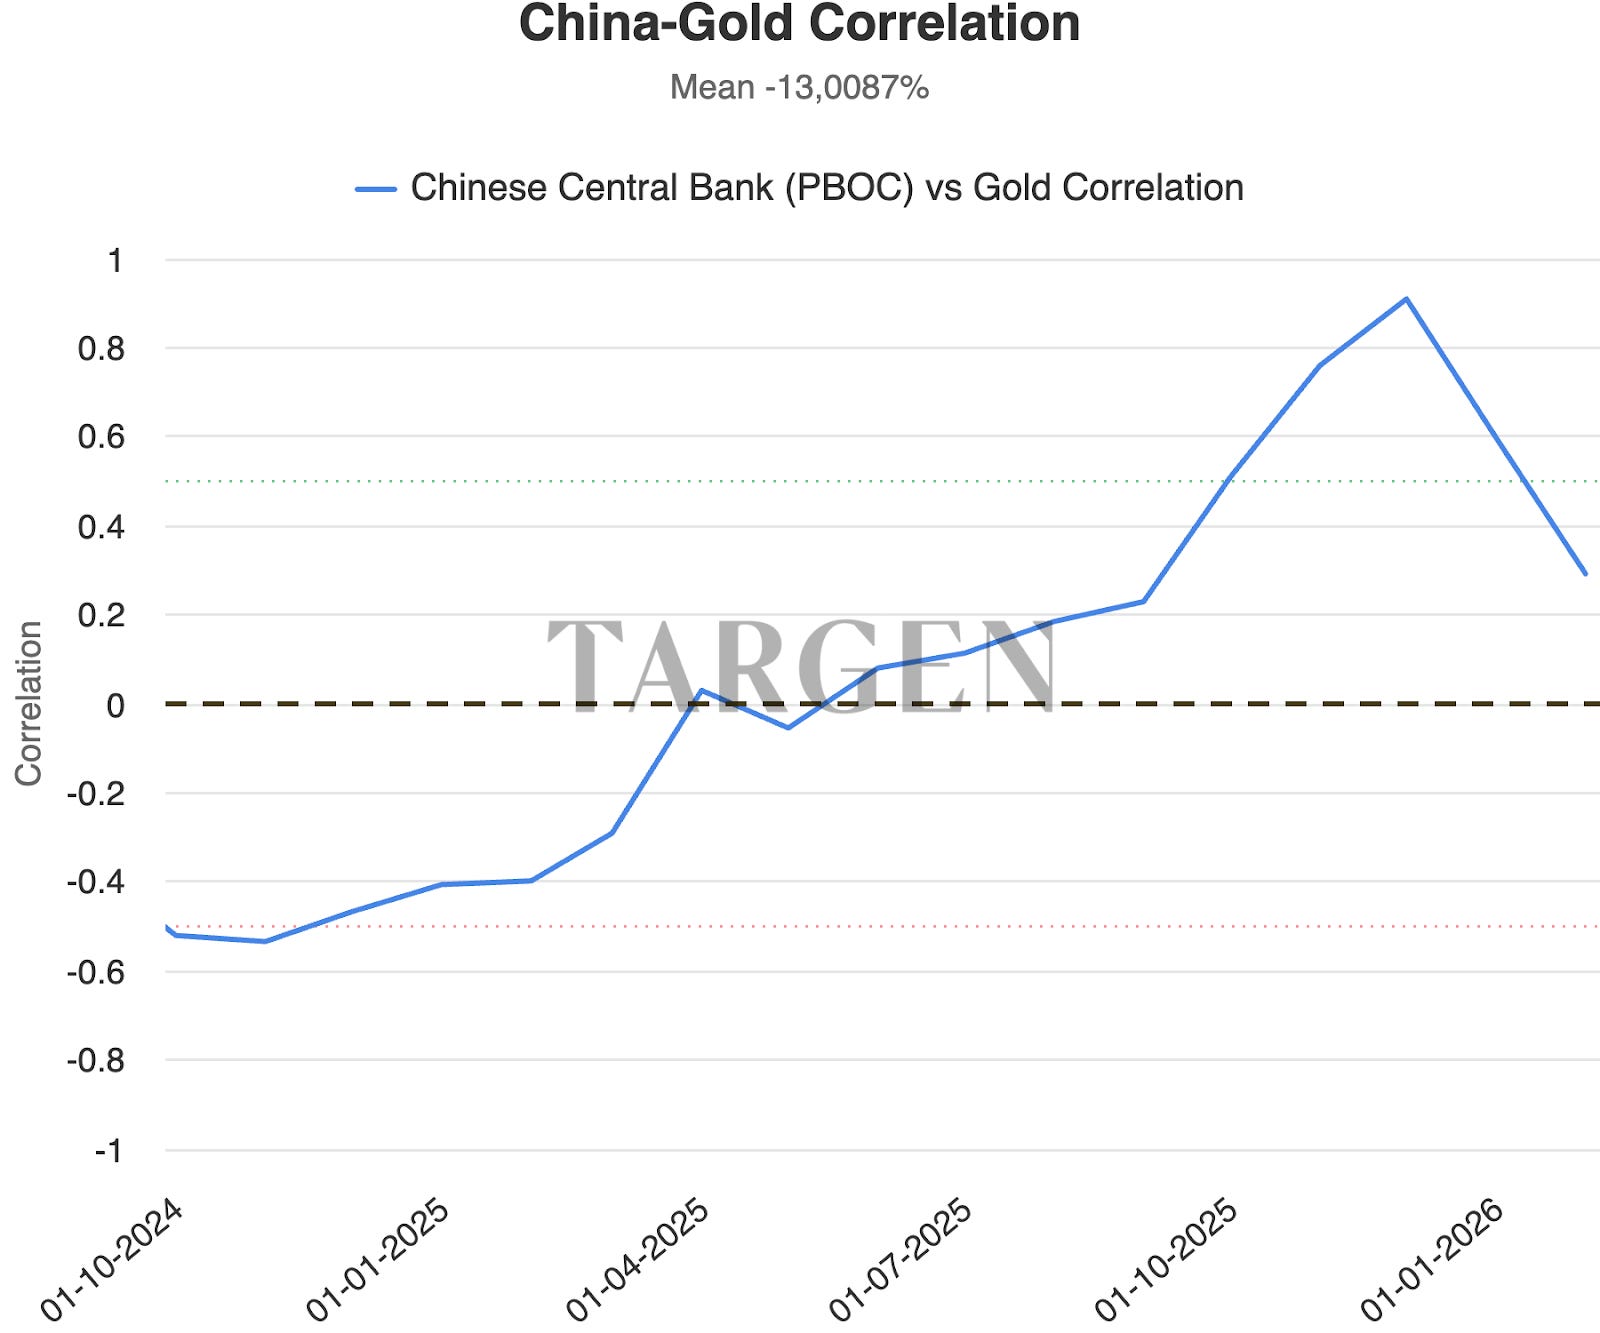
The result in gold was exactly what the model predicted. The correlation between Chinese liquidity and the gold price reached 0,9 during this recent rally — an extremely rare level indicating that PBOC flows were the primary driver behind gold’s surge.
What About Bitcoin? China Moves It Too, Just Differently
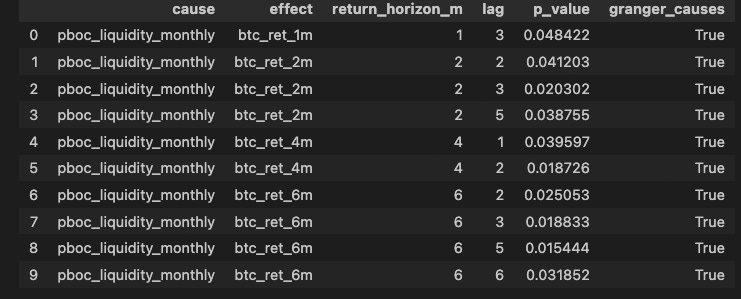
The natural question is: if Chinese liquidity moves gold, does it also move Bitcoin?
The answer is yes. But with two crucial differences: with less intensity and over a longer timeframe — a 4 to 6 month lag.
This raises a revealing point. The fact that gold consistently anticipates Bitcoin’s moves may not be just a portfolio rotation. It could be the residual effect of Chinese capital taking a longer path to reach Bitcoin.
Think about it: China bans Bitcoin trading. Chinese capital cannot flow directly into crypto. But it can — and apparently does — flow first into gold (an asset the Chinese government actively encourages) and from there redistribute through the global financial system until it reaches Bitcoin indirectly. Money doesn’t disappear; it finds another way.
The American Side of the Equation
Chinese liquidity is part of the story. But we know from previous tests that the main short-term driver of Bitcoin is American flow — the liquidity injected by the Federal Reserve and the dynamics of the dollar market.
And here’s the problem: in recent months, the Fed’s balance sheet has been contracting or stagnant, hovering near minimum levels. Without American fuel, Bitcoin lacks its main catalyst for significant short-term rallies.
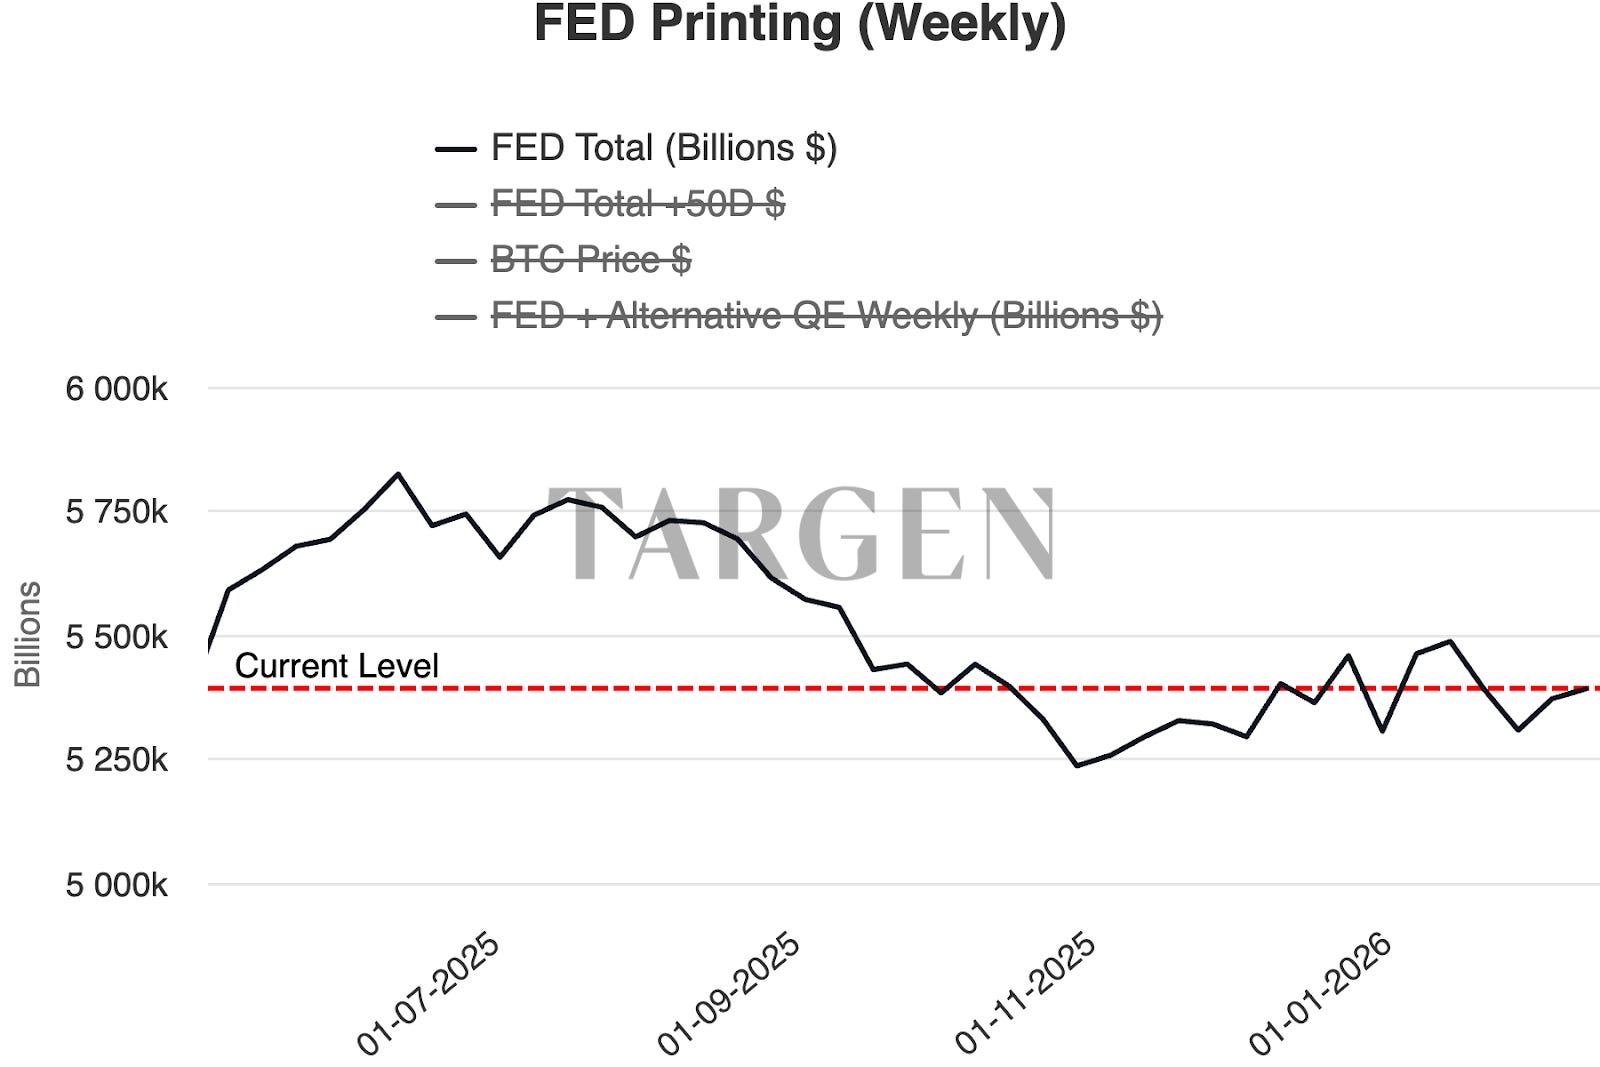
That’s why, despite all the positive signals from the Chinese side and the distortion in the BTC/Gold ratio, the exact timing of the convergence remains uncertain.
The Distortion Nobody Should Ignore
Now we arrive at the most important data point in this analysis.
The ratio between Bitcoin’s price and gold’s price is a metric that, historically, reverts to the mean. When gold rises much faster than Bitcoin, this ratio falls. When Bitcoin surges, it rises. Over the long run, excesses correct themselves.
And right now, this ratio is in extreme territory.
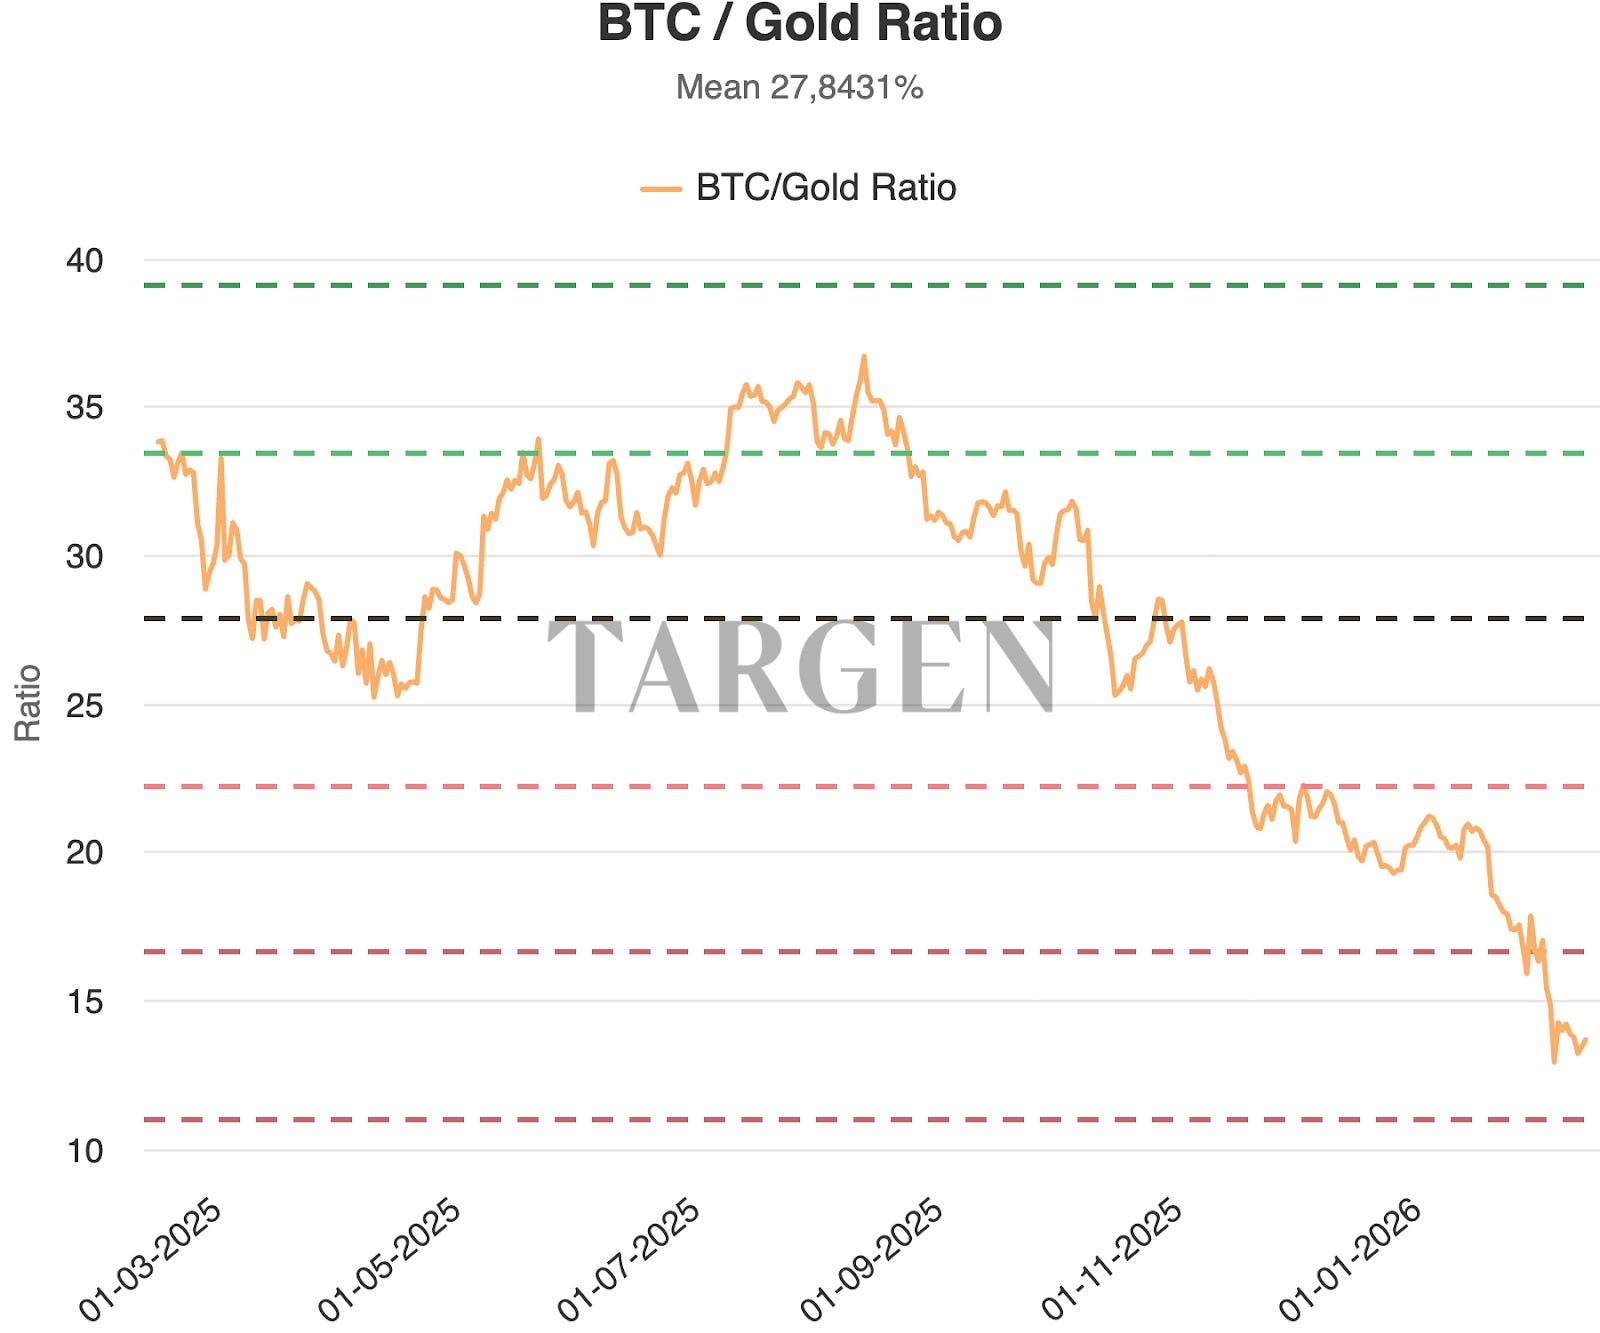
The black line at the center of the chart is the historical mean. And the current ratio is already approaching the third standard deviation — a statistical distortion that, to put it in perspective, occurs with a probability of less than 0.3% in a normal distribution. This is the kind of anomaly markets don’t sustain for long.
By our metrics, this type of distortion historically corrects over an 18-month period. But this has been changing. Using data from recent years, as Bitcoin entered the mainstream, that timeframe drops to 7 to 8 months.
What does this mean in practical terms? If gold holds at $5,000, Bitcoin would need to rise to $140,000 just to return to the mean ratio between the two assets. We’re talking about more than 100% appreciation from current levels.
What to Do With This Information
We have no doubt that this convergence will happen. The question is not if, but when. And for now, American liquidity data suggests the move may not be immediate.
But here’s the point: you now know, through a statistically robust metric, that Bitcoin is priced far below what its historical relationship with gold would suggest. There is a real, measurable discount.
For those with low time preference — meaning you can allocate capital you won’t need in the short term — every additional drop makes the opportunity larger. Not smaller.
Gold has already made its move. Historically, Bitcoin follows. The only variable is time.
And time, for those who know how to wait, is the greatest ally.