

The Illusion of Global M2 as a Predictor of Bitcoin
Yep, you read that right. We'll explain why.


Appearances Can Be Deceiving
The popular saying “appearances can be deceiving” is often applicable to the world of investments: numbers are frequently not what they seem. Those who ignore this reality, in essence, treat investing as if it were gambling: clinging to the surface of correlations while ignoring what truly matters — cause-and-effect relationships. That is why, in order to invest seriously, one must go beyond the layer of appearances and correlations to deeply understand what the numbers actually represent. In this article, we intend to do exactly that with a very famous and important metric in the crypto world: M2. This measure has been widely misused, especially by low-quality influencers abroad.
This appearance of truth has been imported into Brazil and is being repeated ad nauseam. However, sooner or later, this falsehood will invariably turn the horde of ignorant and unsuspecting investors into casualties, who will then begin to propagate the claims every disillusioned former believer makes: that the crypto market is a bubble, that it is manipulated, and so on.
What Is M2?
From an economic standpoint, M2 is considered a monetary aggregate — that is, the sum of certain components that measure how much money is in circulation within a country. It is an officially calculated and published measure by the Central Bank of Brazil, and the same standard is followed by other countries and central banks that issue their own currency. In short, M2 is used as a measure of the total money supply of a country.
How Is M2 Calculated?
Since there are several monetary aggregates (i.e., sums of money) officially calculated by central banks, here are the most well-known: Monetary Base, M1, M2, M3, and M4.
Monetary Base:
Printed Currency: Physical banknotes and coins in circulation +
Bank Reserves: Money that commercial banks keep on deposit at the central bank or in their vaults.
M1:
Currency in Circulation: Banknotes and coins held by the public (outside the banking system) +
Demand Deposits: Balances in checking accounts.
M2:
Everything included in M1 +
Savings Deposits: Savings accounts that allow withdrawals +
Short-Term Time Deposits: Certificates of Deposit (CDBs) and other short-maturity deposits +
Other Highly Liquid Financial Instruments: Such as funds that invest in short-term, highly liquid financial instruments.
These monetary balances can only increase if more money is printed or digitally created, thereby expanding the money supply in circulation. For this reason, M2 is often used as a basis for identifying whether the money supply is growing.
This is basic knowledge for any “bitcoiner”, but it is worth restating the definition because the conclusion is not so obvious.
M2 is a measure of money circulating in the real economy, not in the capital markets. It includes cash in circulation, demand deposits, and also highly liquid savings and time deposits — resources that households and businesses keep for daily expenses, emergencies, or relatively immediate purchases.
In other words, M2 captures the monetary base that fuels consumption and ongoing economic activity. By contrast, capital markets and investment flows — which tend to influence assets like Bitcoin — stem from a different dynamic: resources that economic agents allocate to financial applications in search of medium- to long-term returns, often pulling them out temporarily from the circuit of immediate consumption.
Thus, while M2 tells us how much currency is ready to circulate in the real economy, it is financial capital—not accounted for in M2—that more frequently flows into speculative or alternative investments such as Bitcoin.
Key Point: Believing that M2 directly impacts Bitcoin means assuming that increases in bank balances, in particular, drive capital flows into the asset — when in reality, this type of capital traditionally fuels the consumption of goods and services in the real economy.
The Increase of M2 Causes Currency Depreciation
The term money supply is very interesting because it automatically carries a fundamental idea: that the value of money is tied to supply and demand. In other words, the value of 1 Real* is influenced by the number of Reais available and the number of people wanting that 1 Real.
*We use the Brazilian currency, the Real, due to proximity, since we are a company based in Brazil. However, the example applies to any fiat currency the reader is familiar with.
The idea that demand exceeding supply causes prices to rise, and conversely, that supply exceeding demand causes prices to fall, is as basic as saying that 1 + 1 = 2. However, this notion — taught in the very first semester of economics programs — seems absent from the repertoire of today’s government leaders and central bank presidents, who insist on the fixed value of money regardless of its supply or demand.
To empirically verify this fundamental truth, just try to buy something with 1 Real. You will discover that today, 1 Real is worth almost nothing, whereas 30 years ago, that same 1 Real was worth something, because it could buy more than it can today.
This phenomenon of currency depreciation resulting from the expansion of the money supply (the increase of M2) is among the most obvious truths for those familiar with the Bitcoin investment thesis, while it appears almost like the discovery of fire to the average person who has never thought about it — especially since it is often omitted even in academic economic training.*
*For the purposes of this article, we consider it unnecessary to explain in detail the relationship between M2 and a country’s GDP. It is enough to alert the reader that, under certain circumstances, GDP growth can offset the inflationary effects amplified by M2.
Our intention here is not to prove this point, since it has already been extensively discussed and intellectually settled, in great detail, within the literature of the Austrian School of Economics.
Some example works include:
The Theory of Money and Credit — Ludwig von Mises, 1912.
Prices and Production — Friedrich Hayek, originally published in 1931.
What Has Government Done to Our Money? — Murray Rothbard, originally published in 1963.
But Are People Really Seeking Protection from Currency Depreciation with Bitcoin?
While the money supply in Reais or Dollars keeps expanding — with inflation targets that are rarely met — in Bitcoin there will never be more than 21 million BTC. Its inflation is programmed, diminishing over time, and was predetermined at its creation, with validity guaranteed by a series of highly decentralized control mechanisms that make altering the rule virtually impossible.
Therefore, Bitcoin was designed to increase in value over time, while national currencies were designed for the opposite: to lose value over time. It would then be expected that Bitcoin’s price performance should outpace the depreciation of fiat currencies. However, the focus of this article is to demonstrate that it does not follow that the increase of M2 across countries causes the rise in Bitcoin’s price, despite this idea being widely spread by internet analysts.
The reality, unfortunately, is that this description so far is more of a narrative to illustrate Bitcoin’s importance, but it does not necessarily hold. In other words, if we lived in a world where these economic principles were understood by everyone, then this logical chain — where rising M2 leads to rising BTC — could be true, since the effect of M2 expansion would naturally drive people to seek protection in scarce, programmatically controlled assets like Bitcoin. But this, unfortunately, is not confirmed by the data.
Wallets holding up to 1 Bitcoin (representing everyday individuals saving) collectively sold 31,968.58 BTC between January 2024 and July 22, 2025, a period in which global M2 reached new all-time highs.
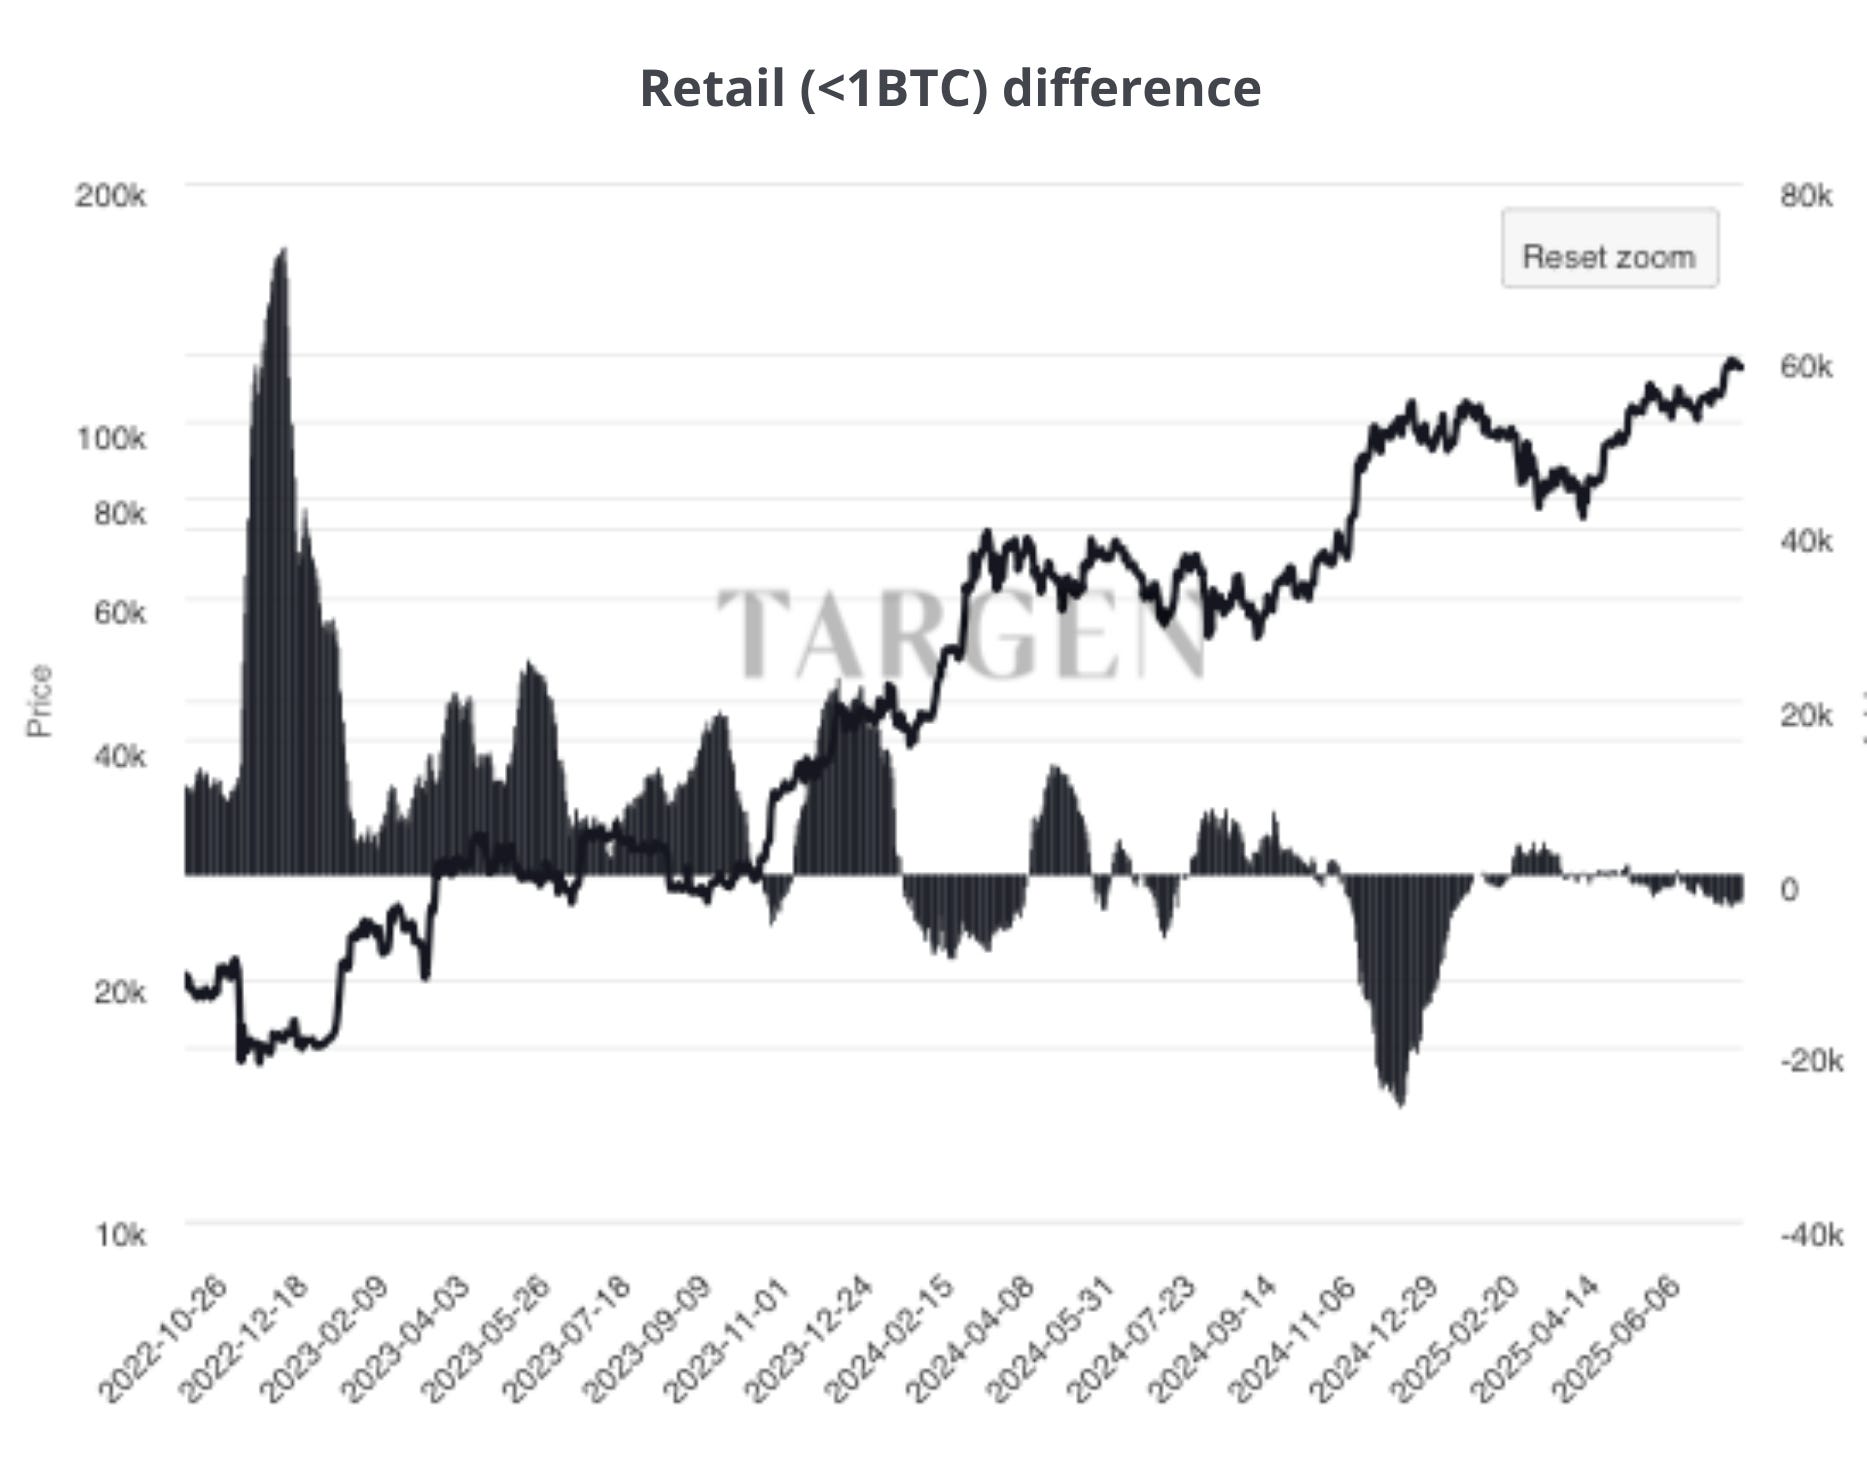
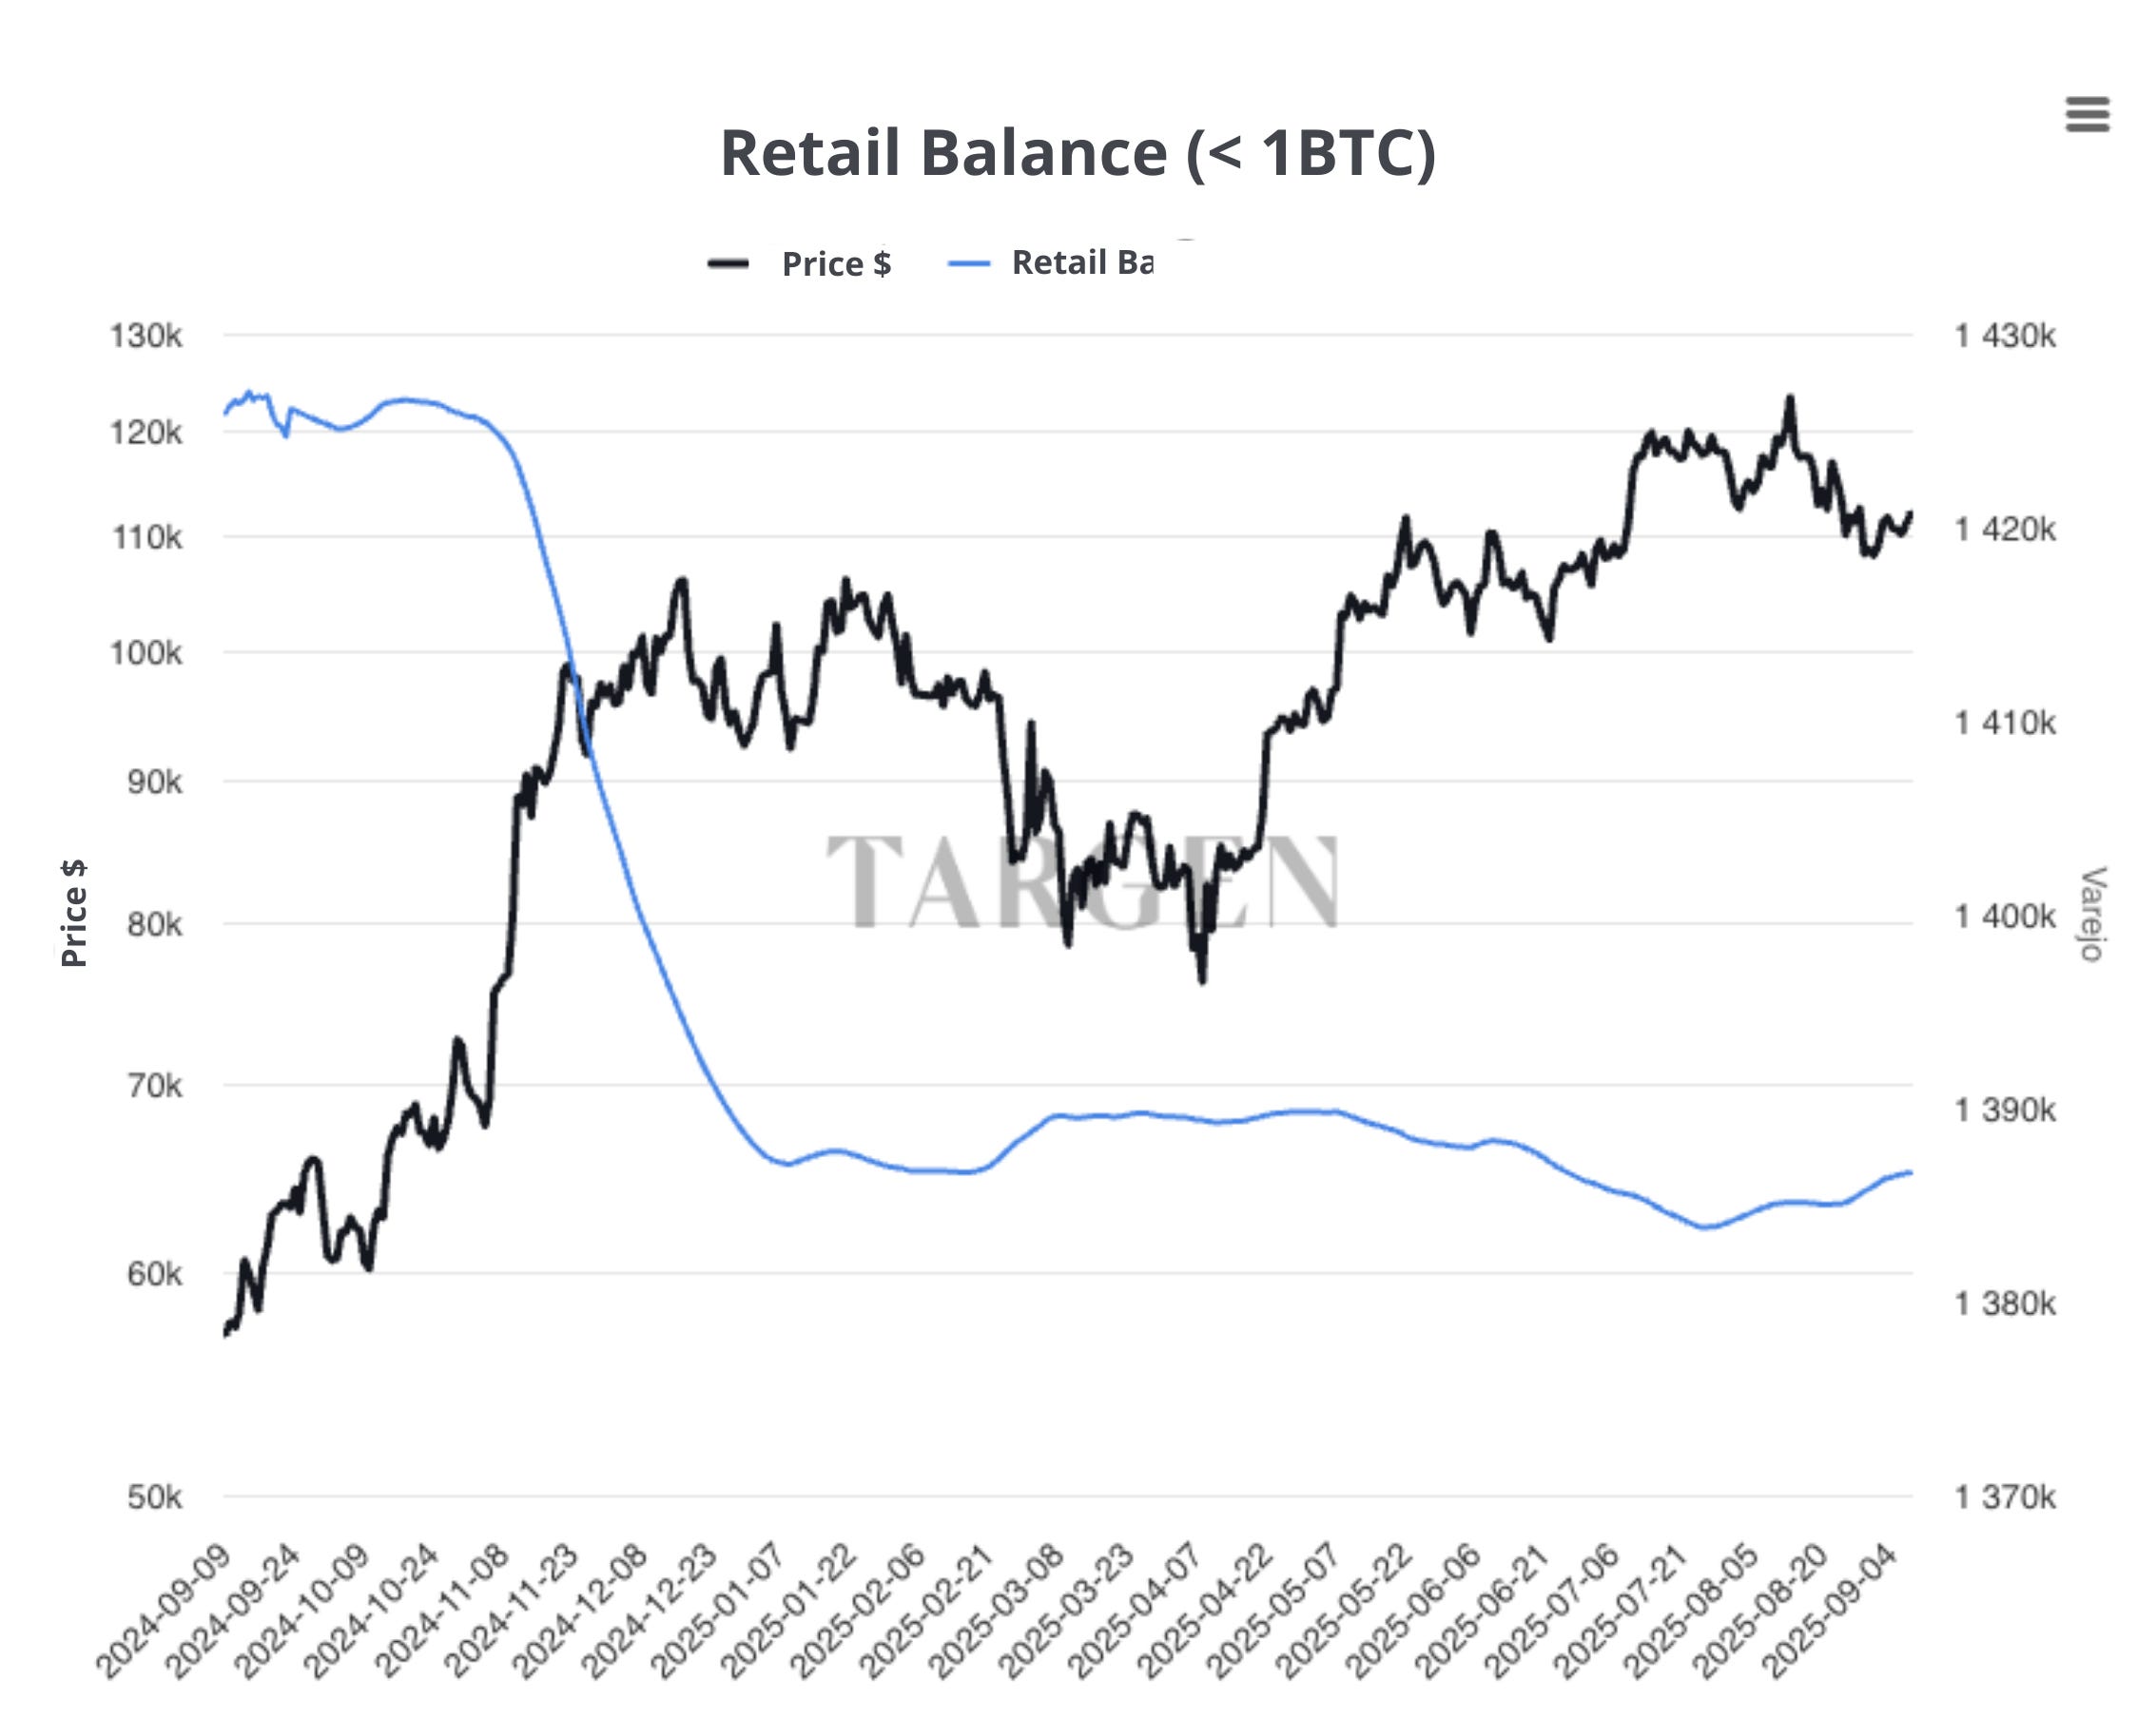
Clearly, people are not massively using their savings to buy Bitcoin. On the contrary, within this segment, we see more speculative sellers — those who bought heavily between 2022 and 2023 and who likely believe that Bitcoin’s bull cycle is coming to an end, relying on the so-called “4-year Bitcoin cycle” thesis, a low-quality narrative popularized on the internet.
The main layer of society impacted by the increase in M2 is not buying Bitcoin; therefore, it is likely not M2 that truly drives Bitcoin’s price.
Technical Study
Let’s Look at the Relationship Between Global M2 and Bitcoin
By summing the monetary expansion of the world’s major countries, we arrive at the figure known as Global M2, popularized by amateur investors as a way to “predict” the movement of Bitcoin. The main argument used is that there is a historical positive correlation between Bitcoin’s price and Global M2. In fact, in certain periods it is possible to observe a correlation of up to 80% — that is, 80% of the time Global M2 rises, Bitcoin’s price follows in the same direction. In Chart 1, one can visually confirm that there is indeed a positive relationship between these variables.
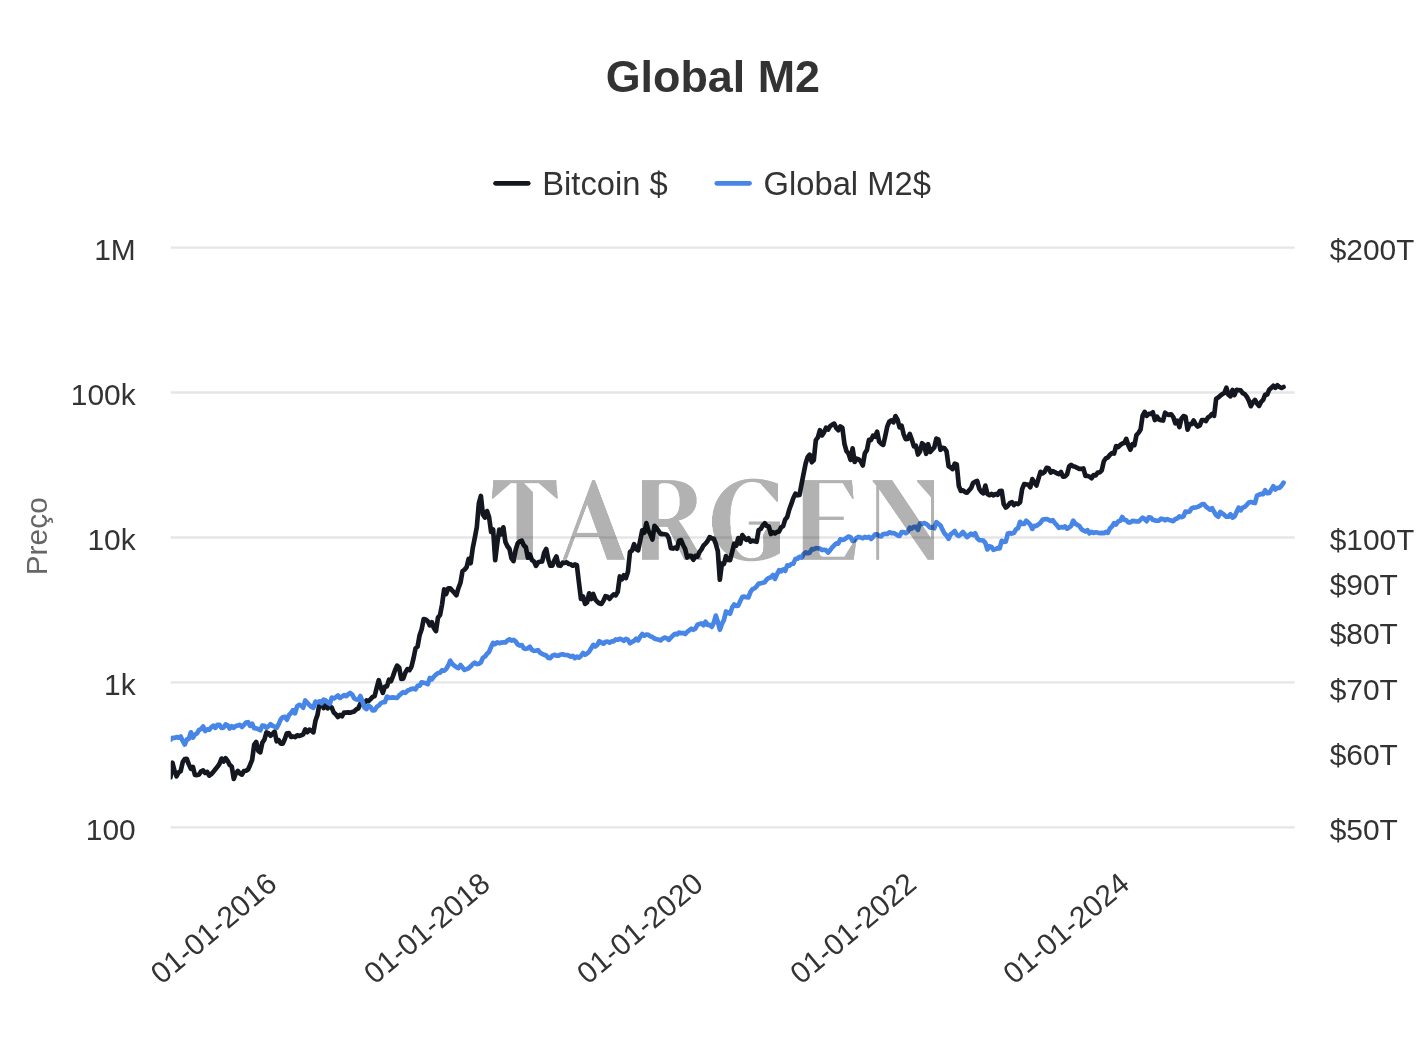
Faced with this, the reader might argue that, with such a high correlation, Global M2 must indeed explain a lot about Bitcoin’s price movements.
However, when we apply the statistical model of Granger causality — which seeks to identify cause-and-effect relationships between different variables — we find a very different answer. Financial literature explains that asset prices do not possess statistical predictability due to the natural characteristics of their variance. Therefore, using price returns is the most appropriate way to model cause-and-effect relationships.
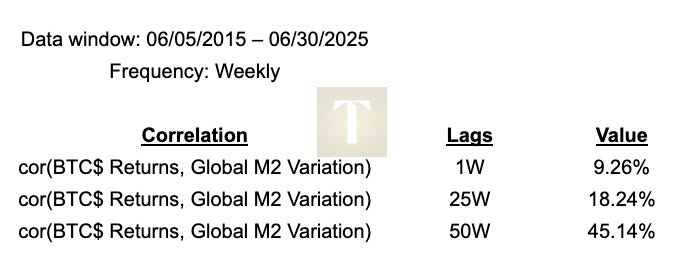
Summary: The correlation of returns is weak, providing further evidence that the initial correlation is merely apparent. We tested windows of 1 week, 70 days, and 107 days.
Causality Relationships
Here, it is necessary to clarify a distinction between modes of analysis: one that seeks correlations, and one that seeks causes and effects. An investor who is content with mere superficial correlations, without caring about causal relationships, places decision-making at great risk, since only cause-and-effect relationships are reliable enough, as they provide explanatory power for financial phenomena and, therefore, greater durability. In other words, correlations that are not capable of explaining causality are, in fact, mere appearances — and, as mentioned earlier, appearances can be deceiving.
Granger causality shows that Global M2 has no causal relationship with Bitcoin’s price movements, as shown in the table below.
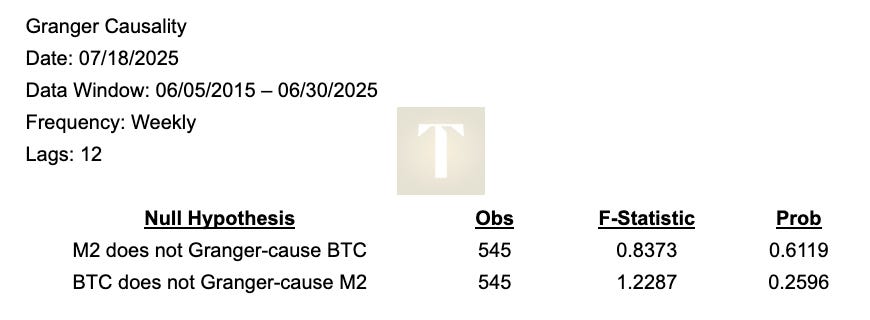
Economic models rely on a series of assumptions that must be verified for the test results to be considered valid from a statistical standpoint. None of these tests produced satisfactory or relevant outcomes when examining the relationship between BTC price and Global M2.
A summary of the applied tests:
Heteroskedasticity: Imagine you are measuring something, like the weight of packages. If the error in your scale varies a lot (sometimes small, sometimes very large), that is heteroskedasticity. The error should not exceed the normal variation of the data.
Error Autocorrelation: Think of trying to predict the weather. If today’s forecast error depends on yesterday’s error, that is autocorrelation. Errors should be independent, as if each forecast started from scratch.
Stationarity: It’s like looking at a city’s daily temperature. If the average (e.g., 25°C) and the variation (e.g., between 20°C and 30°C) remain stable over time, the series is stationary. If they change significantly, it is not.
Statistical models rely on a series of assumptions that must be verified for the test results to be considered valid from a statistical standpoint. None of these tests produced satisfactory or relevant results.
Conclusion: The explanatory power of Global M2 in relation to BTC price is very low and violates several statistical assumptions, such as heteroskedasticity, autocorrelation of variables and estimation residuals, and lack of stationarity. Therefore, it is not sufficient for making accurate predictions or informed decisions.
Regressing the Price
In the chart below, it is possible to see how this equation exhibits a highly random characteristic.
Given the high correlation but lack of evidence of causality, we sought to infer whether BTC price and Global M2 hold any predictive power using linear regression. We applied 6-week returns to smooth out noise and used the annual variation of Global M2 as the independent variable.
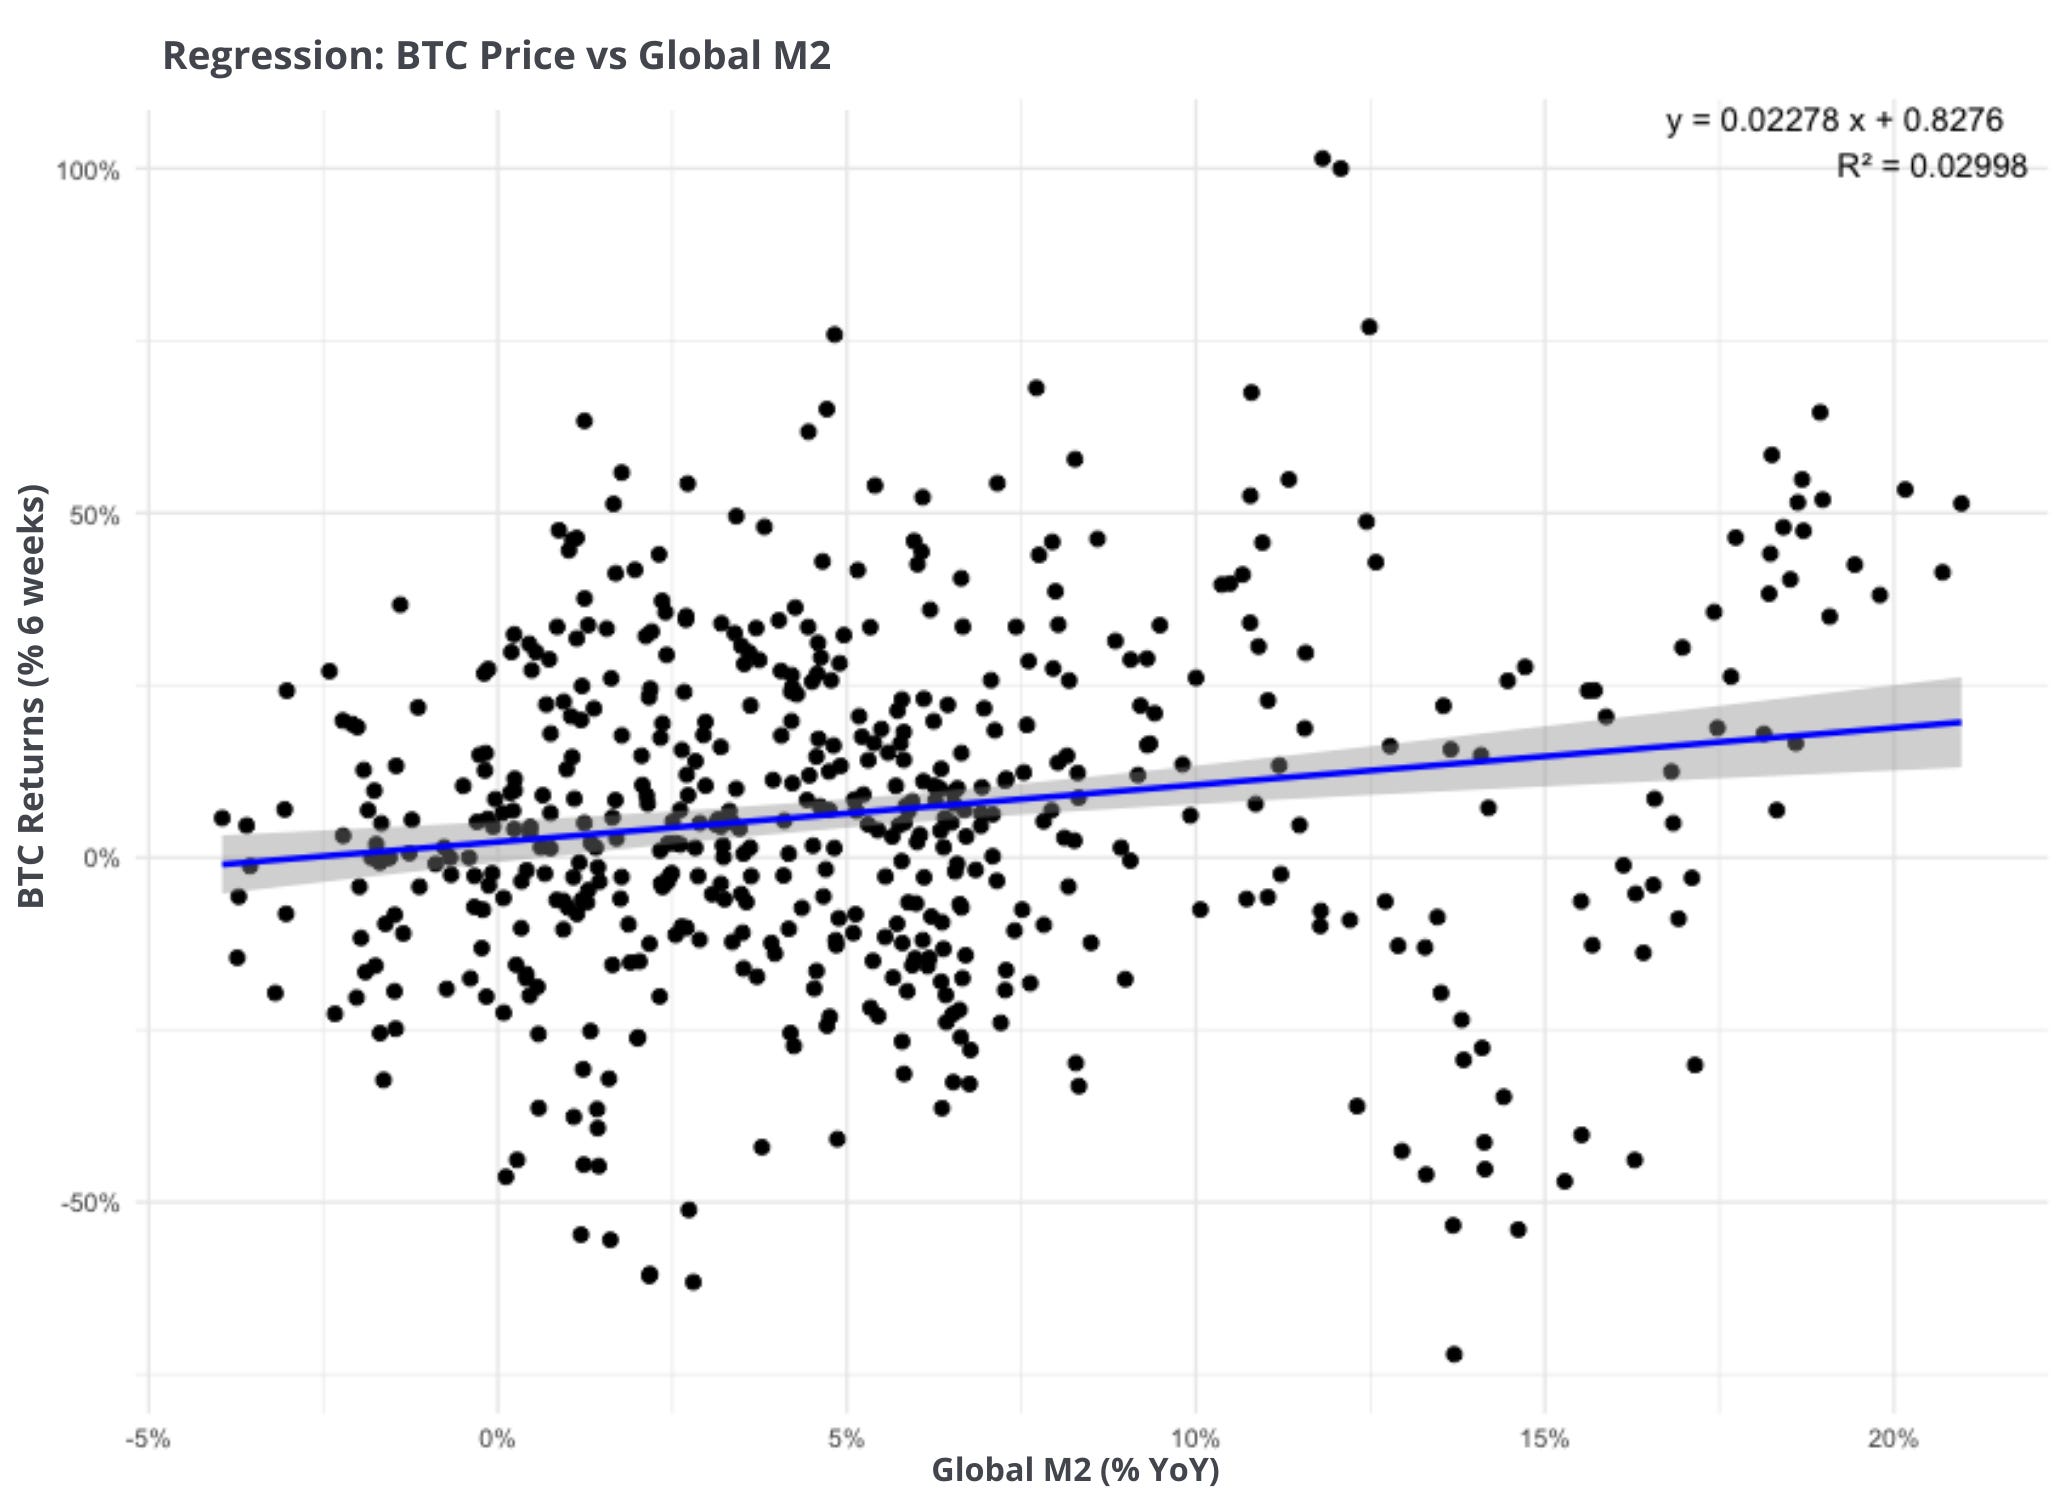
Although there is statistical significance between the variables, the R² shows that no relevant economic relationship exists between them over time. If there were a connection, the black dots representing the interactions between the two variables would be much closer to the blue line. Since they are not — and the dispersion is very large — what we observe is the opposite of a strong connection, something that is considered a random process.
Still, there are those who, even knowing the lack of causality between Global M2 and Bitcoin, attempt to make forecasts and decisions based on this indicator, relying on how the crypto market might interpret it.
Conclusion
Although the apparent correlation between Global M2 and Bitcoin’s price may seduce inexperienced investors, rigorous tests — such as Granger causality and linear regressions — reveal that this relationship is illusory, violating statistical assumptions.
M2 captures monetary expansion that drives consumption and fiat currency depreciation, but it does not dictate capital flows into speculative assets like Bitcoin. These flows are driven by distinct dynamics, including technological adoption, regulation, and market sentiment.
The central lesson is clear: in the world of investing — especially in cryptoassets — it is not enough to observe superficial patterns; it is essential to dig into causal relationships to avoid traps. Influencers who spread simplistic narratives based on unfounded correlations not only perpetuate myths but also fuel cycles of euphoria and disillusionment.
For the serious investor, Bitcoin represents a hedge against the programmed inflation of state currencies, but its appreciation depends on deep understanding, not on misinterpreted metrics like M2.
Therefore, abandon appearances and embrace causal analysis: it is the path to informed and sustainable decisions in the volatile world of cryptocurrencies. Remember: what seems obvious is not always true — and ignoring this may come at a high cost.
 | A guest post by
|
 | A guest post by
|