

The Indicators That Changed How We Manage $26M in Crypto


In the fast-moving world of cryptocurrencies, many investors turn to simple, widely available indicators to guide their decisions. But these tools are often shallow, built on shaky patterns, and deliver inconsistent results. In this article, we dive into a detailed breakdown of professional-grade indicators, highlighting the gap between amateur tactics and sophisticated strategies crafted by seasoned investors. Let’s bust some myths and explore metrics grounded in real data — like capital flows, supply, demand, and market sentiment.
The Problem with Amateur Indicators
You’ve probably seen content online hyping up indicators like the “Bitcoin cycle” — a simplistic “three up, one down” formula — or specific dates, like the 22nd of each month, as magic moments to buy or sell. These patterns, often based on just a couple of historical events, are more like superstitions than reliable strategies. For instance, selling all your Ethereum on the 22nd because “it happened the last two times” is a reckless approach designed to grab attention rather than deliver consistent profits.
Another popular tool is the Fear and Greed Index from Alternative.me, which tracks market sentiment.
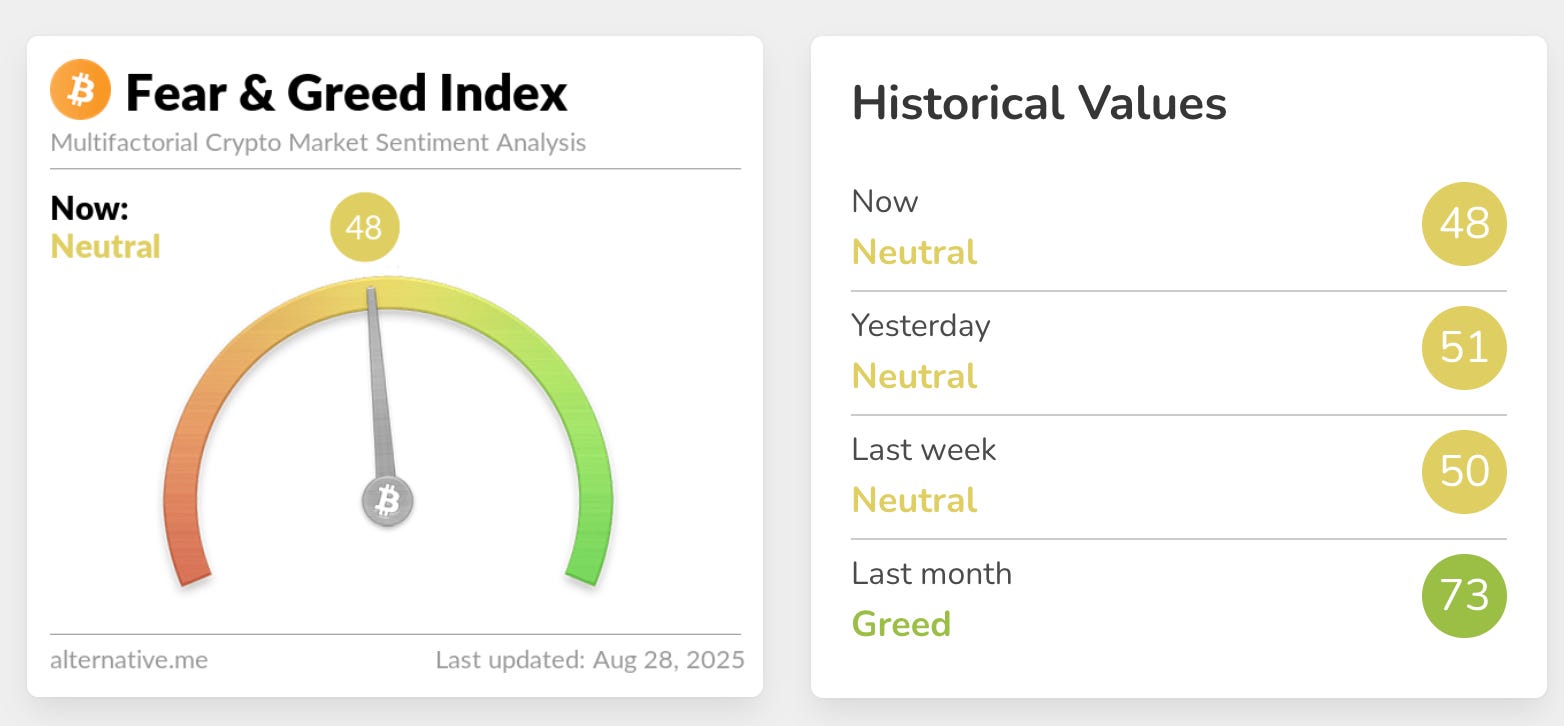
The problem? It’s lagging.
It signals euphoria only after prices have already skyrocketed and pessimism after steep drops. Historical tests show, counterintuitively, that future returns are often higher when the index hits extreme greed (near 100), but this reflects its reactive nature, leading to poor decision-making if you buy at the peak.
These tools are accessible to anyone — even a kid could find them with a quick Google search. If everyone has the same public, free information, it gives you no edge over professional investors. In the stock market, similar approaches — like trading based on specific days or times — were debunked years ago. Crypto, still a relatively immature market, allows these “tips” to circulate widely, but they turn investors into gamblers, not analysts.
Professional Indicators: Raising the Level
To contrast with amateur tools, the indicators we build at Targen are made composing over 300 variables and backed by statistical validation. These aren’t based on random patterns but on clear cause-and-effect relationships, like how capital flows influence sentiment, demand, and, ultimately, price.
The Capital Flow Indicator
One key indicator tracks the variation in capital flows within financial markets, measuring whether there’s more or less money circulating. The logic is straightforward: when there’s plenty of available capital (from savings or high liquidity), some of it tends to flow into financial assets, including crypto. This indicator is “forward-rotated” to account for the lag between capital availability and its market impact.
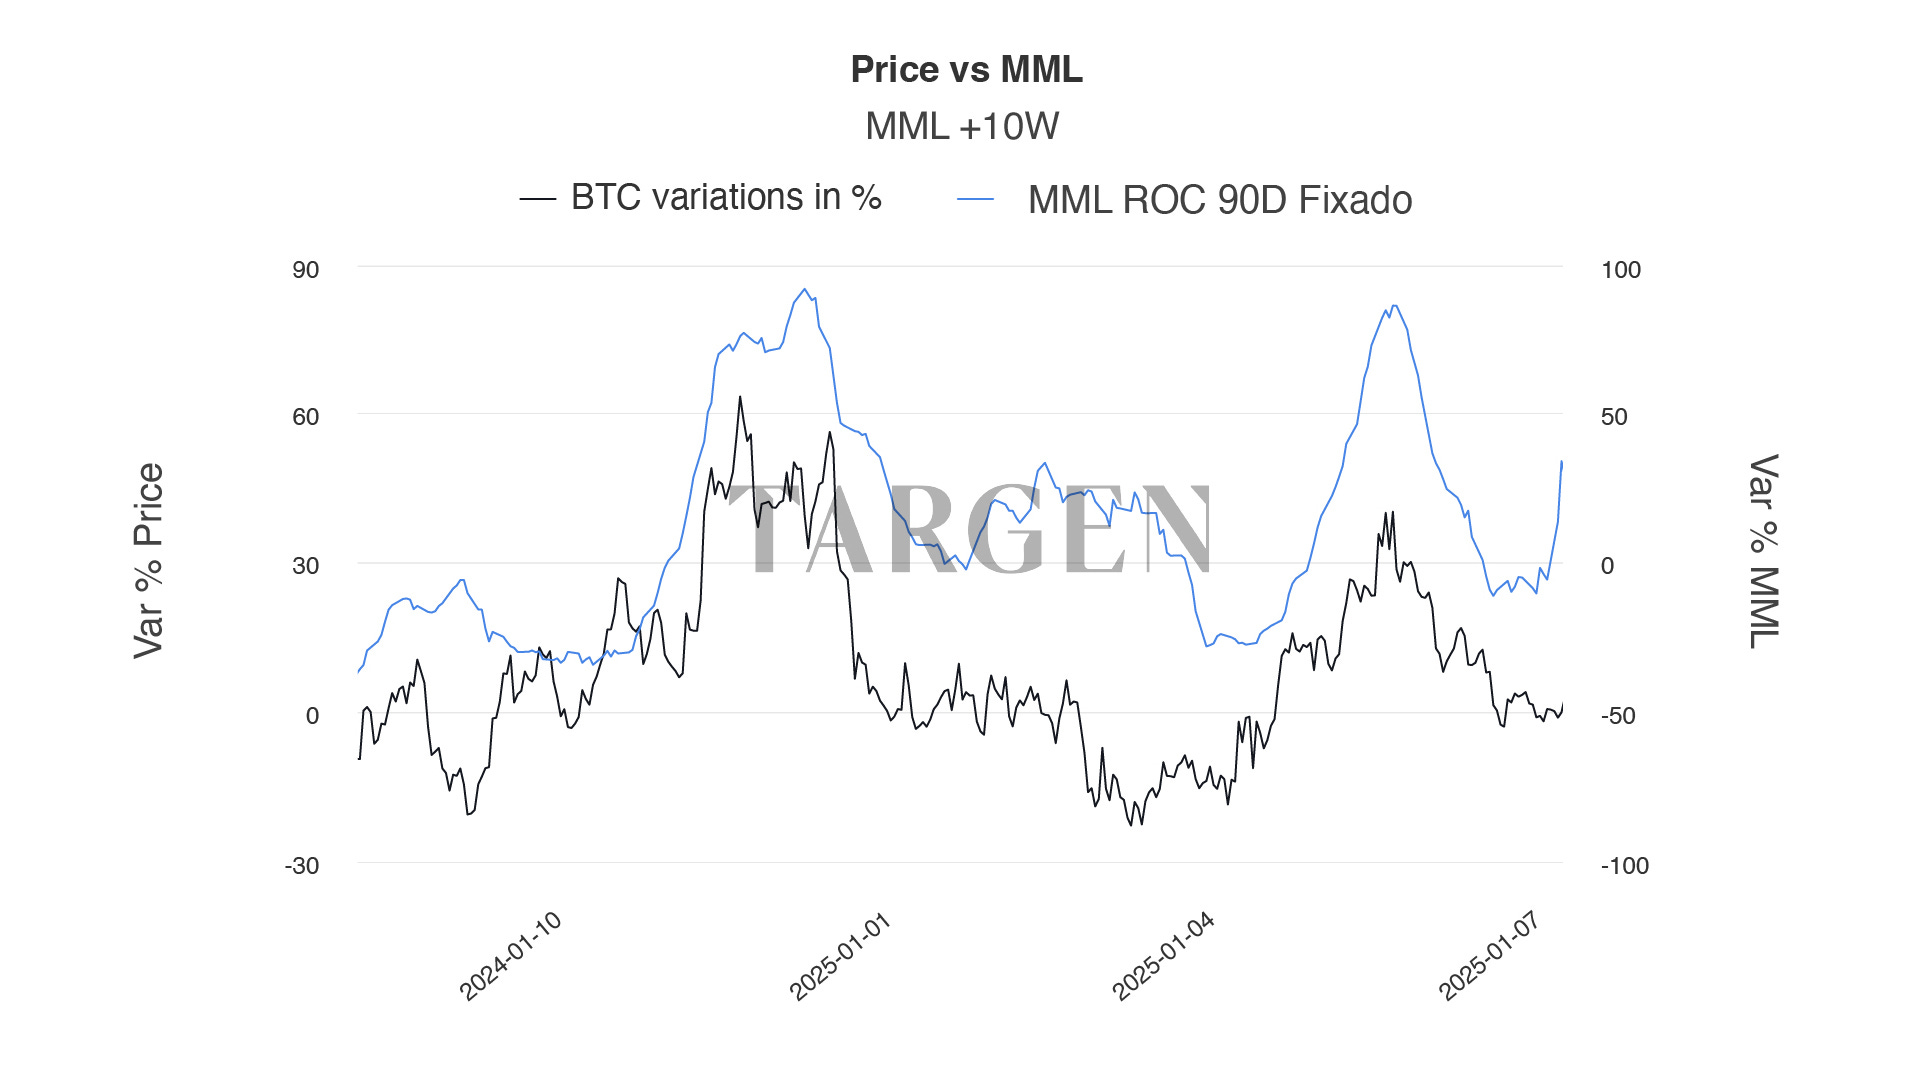
Historical charts show a striking correlation between this index (in blue) and Bitcoin’s price (in black). For example, during periods of rising capital flows, Bitcoin’s price tends to climb with high probability. We used this indicator to predict Bitcoin would hit $120,000, a forecast that came true. Importantly, this isn’t the M2 money supply metric — it’s a unique, proprietary measure far more precise.
Supply and Demand: The Core of Everything
All financial assets — from commodities like corn and soybeans to stocks and bonds — are driven by supply and demand. In crypto, models like Stock-to-Flow focus solely on supply (Bitcoin’s 21-million cap), assuming constant demand, which is a flawed oversimplification that’s already been discredited.
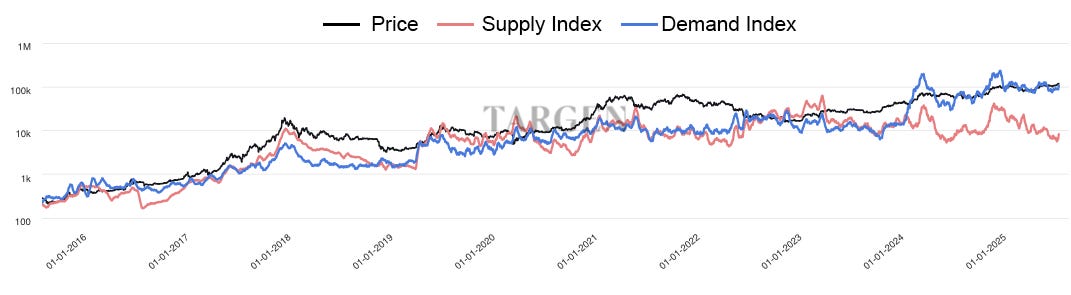
Targen’s supply and demand indicator combines both forces. Historical charts show that during price peaks in 2017 and 2021, supply outstripped demand, acting as a brake on prices. Since 2024, demand has consistently exceeded supply, driving Bitcoin’s recent surge to around $120,000. This suggests the asset isn’t “overpriced” but fueled by real imbalances.
Supply isn’t just about Bitcoin’s limited issuance. The index includes subcomponents like:
Available supply: roughly 3 million Bitcoins on exchanges, plus 5 million with a high likelihood of being sold (based on on-chain movements).
Profit-taking: when prices spike (e.g., from $70,000 to $109,000), holders sell for profits, increasing circulating supply.
Exchange inflows: Signals intent to sell.
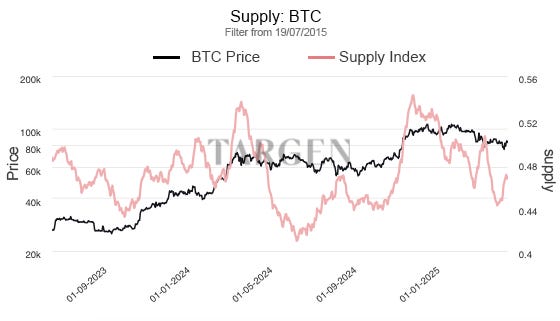
Supply spikes explain pauses in rallies, like in March 2024 (when prices jumped from $40,000 to $70,000) or January 2025. While supply drops, prices often rise; large supply surges act as brakes.
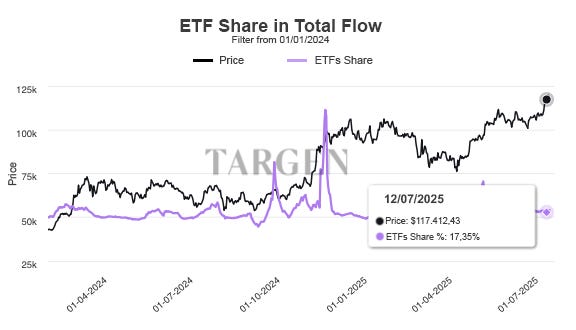
Demand is measured through buying flows, network usage, and genuine interest. ETFs (like BlackRock’s) are overhyped online because they’re public, free data — but they account for less than 20% of total buying flow (data from July 12, 2024). Targen’s indicator captures broader flows, anticipating market moves.
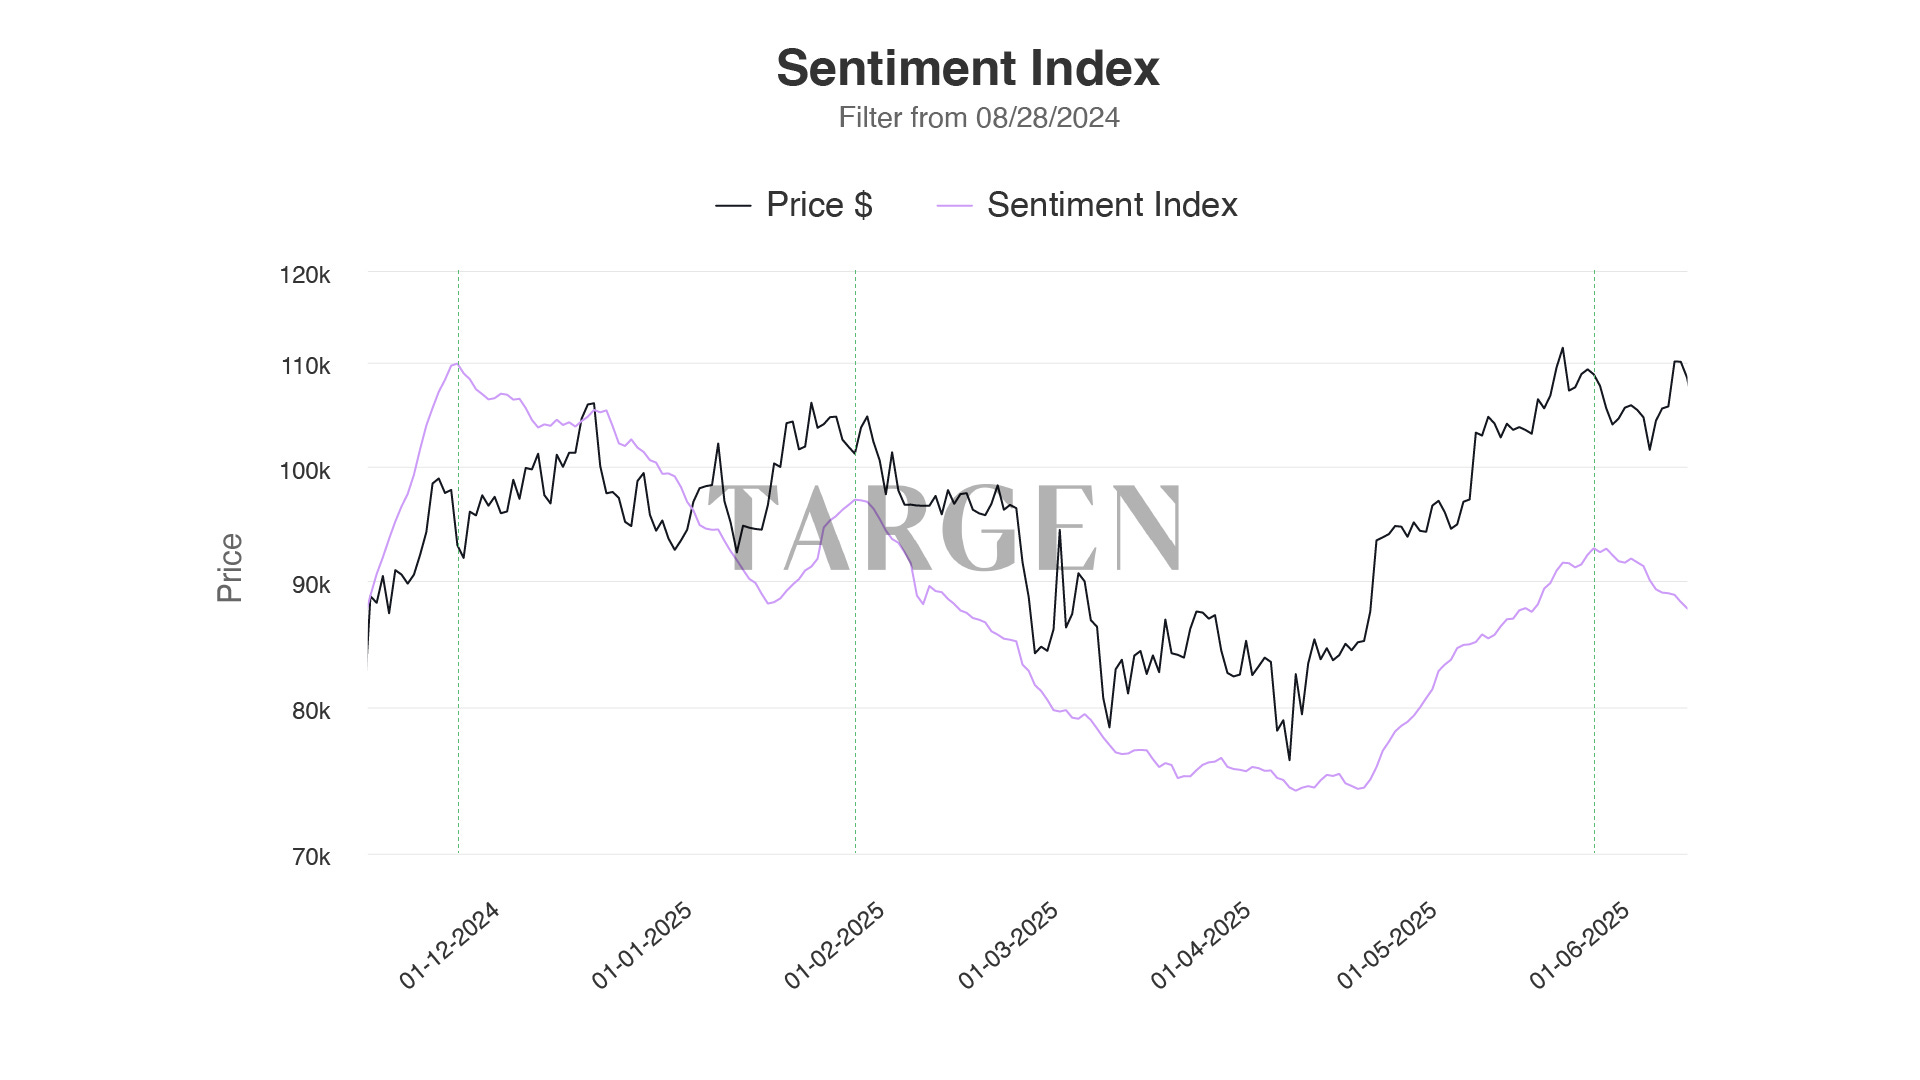
Market Sentiment: Real Positioning
Unlike Alternative.me’s index, our sentiment metric focuses on player positioning — realized profits/losses, position sizes, and trading patterns. It anticipates demand by up to a month, accelerating during rallies like July 2024. Major players position themselves ahead of events, much like in the stock market.
Connecting the Dots: Cause and Effect
These indicators work together logically:
Rising capital flows → Sentiment accelerates → Demand surges → Prices climb (with low supply).
Statistical tests confirm their significance, unlike amateur patterns. Compared to “superstitions” or public data, this approach gives a real edge, turning bets into investments.
Conclusion: Invest Smarter
The gap between amateur and professional indicators is massive. While the former rely on guesswork or lagging data, Targen’s tools offer rigorous, predictive analysis.
If you want to invest like a pro, follow work like this. Don’t blindly hit the buy button — analyze real data. Check out the related links for more, and share this with friends who need to raise their investing game. Crypto is still young, but with the right tools, you can navigate it with confidence.
Who Is William Strapazzon?
William Strapazzon is a professional crypto investor with a proven track record: he made millions navigating this volatile market. Now, with Targen, he helps hundreds of people invest smarter without managing their funds, promising unrealistic returns, or selling courses. His approach is rooted in transparency and education, setting him apart from influencers who prioritize entertainment over rigorous analysis. His goal is to raise the bar, comparing superficial information (like what you’d find in mainstream media) with professional-grade data to empower investors to make informed decisions.
 | A guest post by
|